Interfaces
Submission interface
Definition of the query
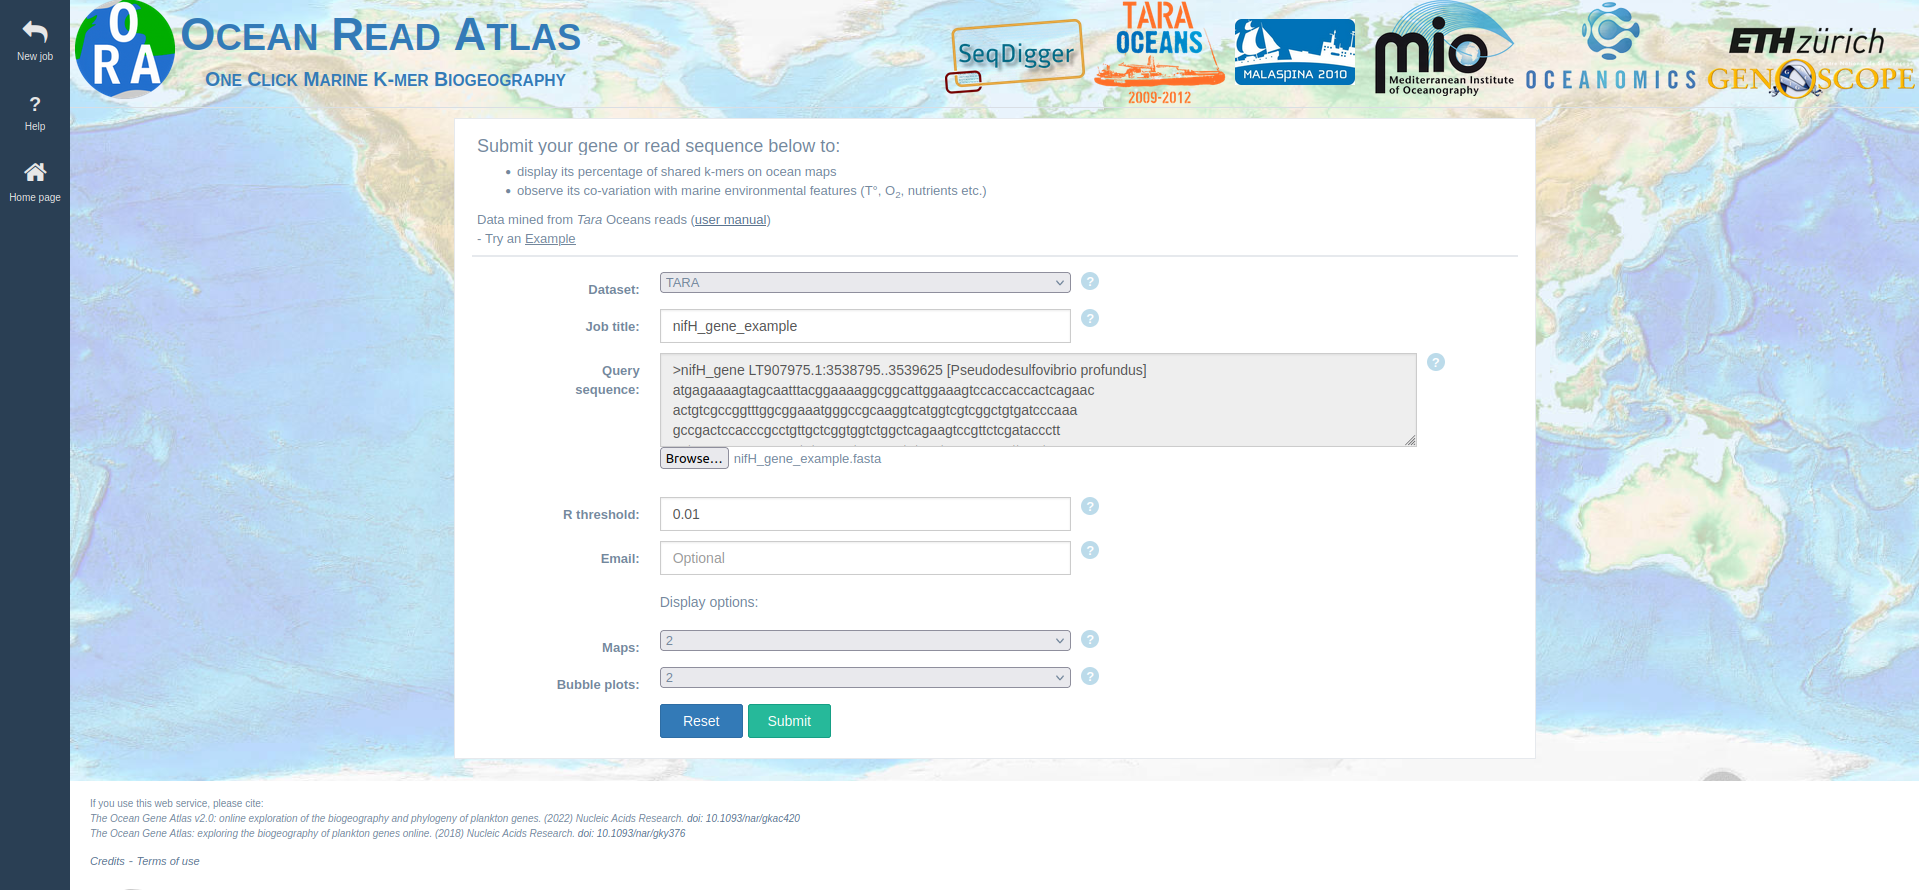
The input query may be one or several DNA sequences in FASTA format to paste in the text field or to upload with the corresponding button (see Figure 1).
Analysis parameters
The parameters to fill in the submission form are the followings (see Figure 1):
Database: Currently only the Tara dataset from the Tara Oceans project (Tara Oceans and Tara Oceans Polar Circle) is available. This dataset contains approximately 6.5 thousand billion indexed nucleotides from 11 plankton size fraction sampling in four sampling depths over the global ocean.Ratio threshold: Samples whose sequence similarity are below this value are not displayed on the result page.
Optional parameters
Two parameters are accessory:
Job title: Text to annotate and name downloadable files.Optional email address: If provided, the results URL of the request will be attached to an email sent to the user. A hyperlink to the results page will be provided at the time of data submission and also included into the optional email. The results will remain available online for 15 days.
Display options
Maps: Define the number of maps used to visualize the geographical distribution of the shared k-mer (each map can display the shared k-mer above a ratio threshold in distinct plankton size fractions and sampling depth).Bubble plots: Define the number of plots used to visualize co-variation of shared k-mer with different environmental parameters (each bubble plot can display covariation in distinct size fractions for a chosen environmental variable).
Results interface
The results interface displays all the computed results via maps and bubble plots. The results are organized by sample, the identity of which are available on mouse hover over the colored circles on the maps and bubble plots. The results will be available on the web page URL for 15 days after job submission.
Job details
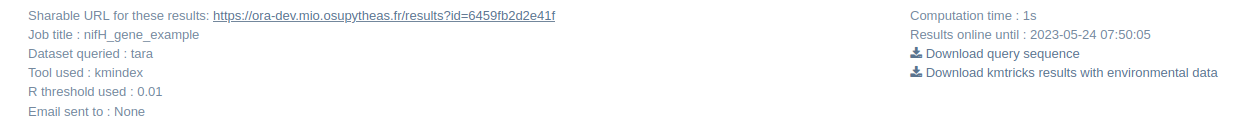
The top panel (Figure 2) provides information about the submitted job (e. g. URL of results page, R threshold etc) and a summary of the query. Two sets of text files are available to download:
the query sequence(s) (FASTA file)
the kmtricks raw results associated to environmental parameters
Maps
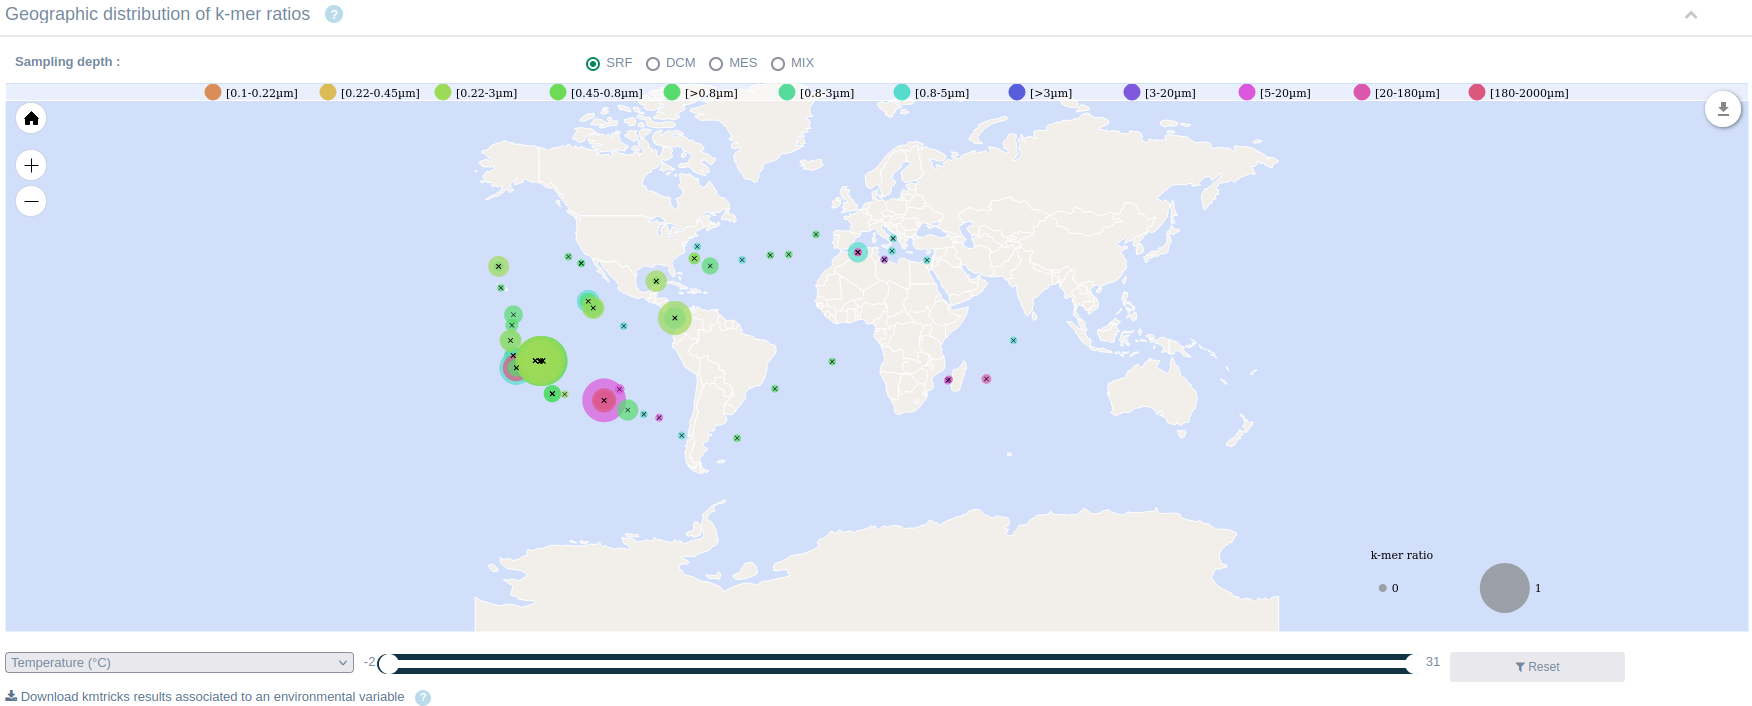
In the interactive geographical maps (see Figure 3), each circle represents the R ratio of selected shared k-mer in one Tara Oceans sample. Different plankton size fractions and sampling depths can be displayed on the maps by selecting the corresponding options above the map. Each plankton size fraction is associated to a color. The different acronyms of sampling depth stand for:
DCM: deep chlorophyl maximum layer.SRF: upper layer zone.MES: mesopelagic zone.MIX: marine epipelagic mixed layer.
Users can choose an environment variable from a list and define the maximum and minimum values using the slider. Then only samples corresponding to the selected range are displayed on the map. It is possible to download the kmtricks results files and environmental variables corresponding to the selection. Using the top-right button, users can edit, print and/or download the map in several formats (see download section).
Bubble plots
The bubble plots associate environmental context with shared k-mers for each sampling depth (see Figure 4). A drop-down menu allows the user to change the displayed environmental parameter.
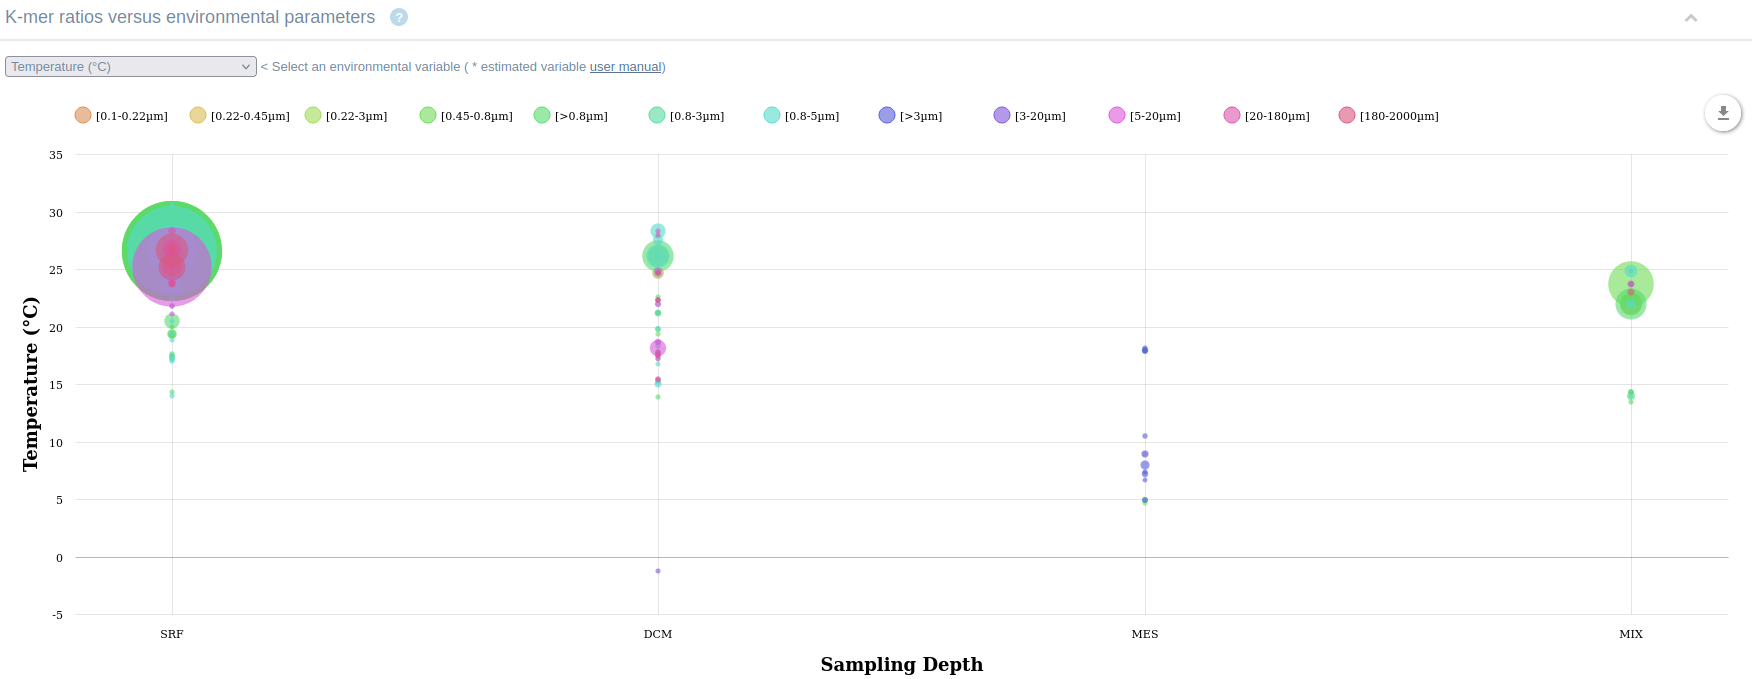
The different acronyms of sampling depth are described above in maps section.
Similarly to the geographical maps above, the sizes of the sample circles are proportional to the k-mer ratio of the query. The circles are color coded according to the selected size fractions. The y-axis represents the environmental parameter value: Alkalinity, Ammonium_5m, Carbon Total, CDOM, Chlorophyll_A, CO2, CO3, Density, Depth, Distance_coast, HCO3, Iron_5m, Nitrate_5m, Nitrite_5m, NO2, NO3, NO3_NO2, NPP_C, O2, PAR, pH, PIC, PO4, POC, Salinity, Si, Temperature. Values estimated from oceanographic models are indicated by a star. Comprehensive detailed descriptions of the biosamples’ environmental context can be found in the resources listed under environmental context section.
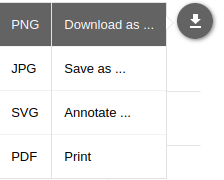
Downloading publication grade figures
Click on the download arrow at the top right of each display panel (see Figure 5) to download as Scalable Vector Graphics format suitable for high resolution post-treatment or publication.